
|
Reports Show that for TV, the More Things Change, the More They Stay the Same Reports pronouncing that mobile devices are the future of media are fairly commonplace these days. It seems somewhat fashionable to tout the insatiable urge of the public for interactive mobile media. While clearly the movement to media on the move is a valid trend, some recent studies also show that not all viewing is done on non-stationary devices. The TV use case where one sits in a fixed location to … watch TV… is alive and well too. Knowledge Networks, a GfK company (GfK acquired Knowledge Networks this past year) produces the Home Technology Monitor, an annual independent survey of television/media technology based on a large probability sample, with several decades of reporting in the archive. In mid-October GfK released a white paper on how primetime viewing has changed in the period from 2004 to 2012 for viewers in the 18-49 age range. Below are some of the charts from the whitepaper, which shows the both the trend toward new media technologies as well as the staying power of conventional media. As would be
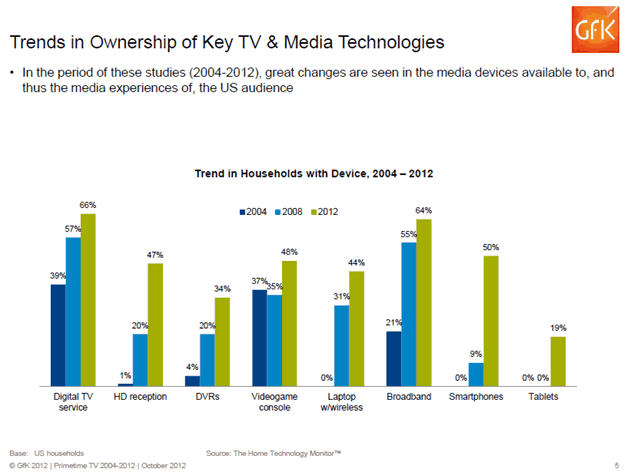
expected, the types of media devices owned by consumers have certainly
changed, as shown in the chart below-for example, tablets and smartphones
are of course much more prevalent in the marketplace now than in
2004. Also interesting is that percentage ownership of devices in
all categories has monotonically increased across the board, including
conventional TV sets.
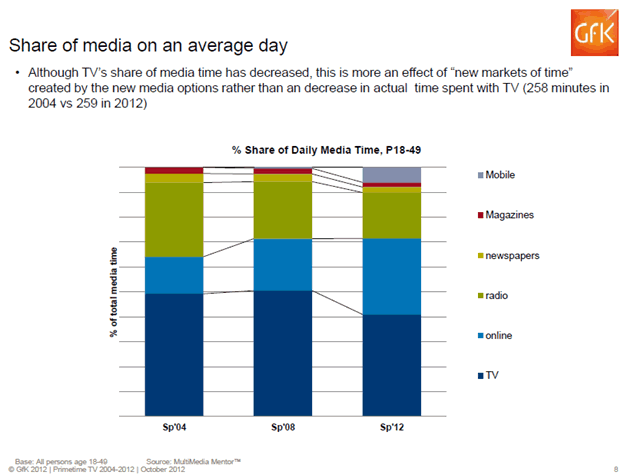
If the types
of new media devices have changed since 2004, it's reasonable to
question whether media usage changed over the same period. Answers
to this question are shown in the chart below. The percentage of
time viewing TV has decreased, and Internet and mobile viewing percentage
has increased. But in absolute terms, the amount of time consumers
spend viewing TV in 2012 is actually higher than in 2004, a consequence
of what GfK calls the "new markets of time" created by
new media technologies.
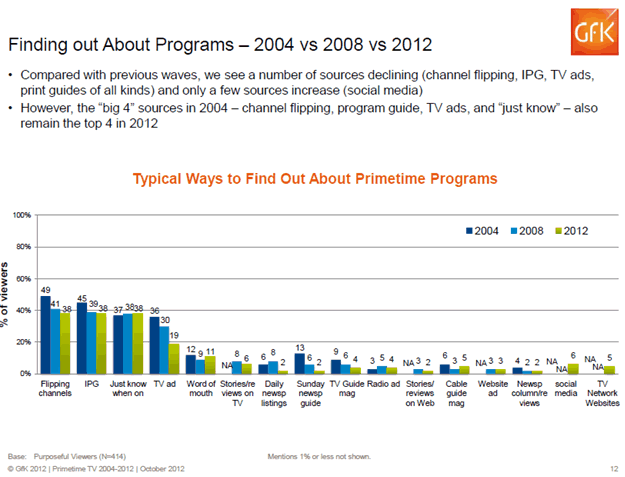
New program
discovery methods have also proliferated since 2004, as shown in
the chart below. But while social media (6%) and TV network websites
(5%) have appeared, the same top four methods of finding programs
in 2004 (channel surfing, integrated program guides, memory and
TV ads) are the same top four methods in 2012. Word-of-mouth is
still a strong information source for what to watch on TV but newspaper
listings and printed program guides have dropped precipitously as
a primary resource.
The 8pm to 9pm
primetime hour used to be pretty much the exclusive province of
the TV set. With more media alternatives available today it is tempting
to assume that the primetime hour would be divided among those new
media activities. The results of questioning this assumption are
perhaps surprising, as shown in the chart below. Watching live programming
has decreased from 82% to 64% over the period, but when added to
programs watched that were recorded, 90% of 18 to 49 year olds are
still watching TV programming in the first prime time hour.
The complete whitepaper can be downloaded from GfK here. Further evidence of the resilience of the TV set as a media mainstay is reflected in a recent study conducted by Verizon and announced on October 24. Verizon has developed the concept of what they call the "borderless customers," identified as those that own a laptop or desktop, own a smartphone or tablet, usually have a device with Internet access on hand, are motivated to make technology and connectivity upgrades and are interested in the benefits of a connected home. A growing audience segment making up almost 40% of the US adult population, 90 percent of borderless consumers say they look forward to the day when every connectable device in their house can seamlessly interconnect and work together - via their in-home network or online. However, the study also shows that 89% of borderless customers still prefer watching shows on the television sets, comparing favorably with 90% of non-borderless customers. Interest in watching television seems to be something everyone can agree on. More about the Verizon borderless lifestyle study can be downloaded here. Daylight Savings Time Begins "Don't forget to check to see if your PSIP generator is sending the correct data. A month before the change in daylight savings time (November 4 this year), it is required to send specific data in the STT. Right now, the DS_day_of_month field must contain the value 4, and the DS_hour field must contain the time when the stations will switch (officially 2, but some stations may transition at a different time). The DS_status bit must be "1" indicating it is still daylight saving time until after the change." |

|
"We apologize for the delay in sending TV TechCheck to you this week. Our production schedule was interrupted by the recent hurricane." |


ADVERTISEMENTS